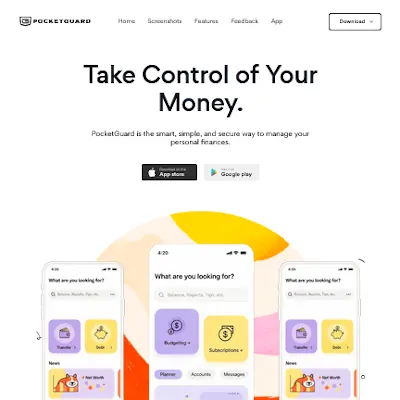

The Life of the Mobile Gamer is an immersive "Scrollytelling" experience that challenges stereotypes about the modern mobile gamer. Built with a focus on data visualization, it uses a split-screen layout where narrative context scrolls on the right while a sticky panel on the left updates dynamically with rich, animated charts.
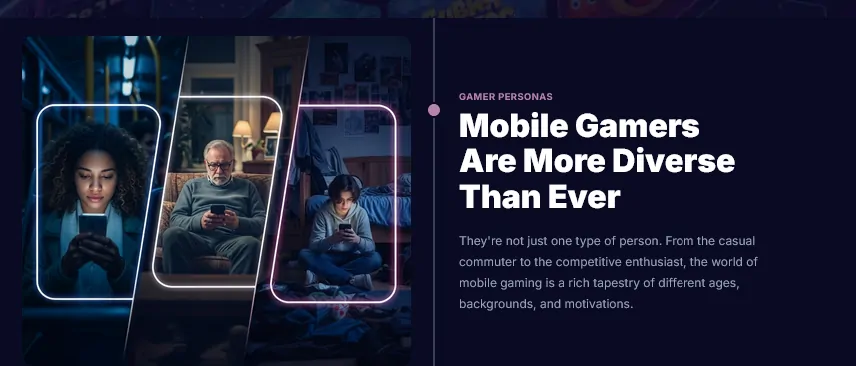
“The mobile gaming audience shatters old stereotypes. It’s not just one type of person; it is a rich tapestry of different ages, backgrounds, and motivations.”
The goal was to transform dry statistics into a compelling narrative. By syncing scroll interactions with complex D3.js and Chart.js animations, the user is guided through the data step-by-step, making insights about demographics and monetization instantly digestible.
The application relies on a robust IntersectionObserver implementation to detect the user's reading position. This triggers specific events such as morphing a D3 chart or animating a number counter to ensure the visuals always match the story being told.
IntersectionObserver for 60fpsThe project avoids heavy frameworks in favor of a performant, vanilla JavaScript approach enhanced by specialized visualization libraries.
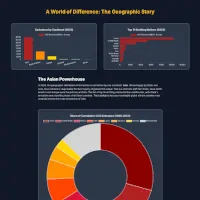
Used for the complex "Global Reach" section, enabling smooth transitions between coordinate systems (Cartesian to Radial).
Implemented for standard statistical representations (Doughnut and Bar charts) with custom data labeling plugins.
Utilized for rapid utility styling and responsive grid management, ensuring a consistent design system.
Core logic handles scroll-tracking, DOM manipulation, and state management without the overhead of React or Vue.
Merging complex data libraries like D3 with a responsive layout presented unique engineering challenges, particularly regarding state transitions and mobile adaptability.
The complexity of "sticky" positioning combined with heavy graphics rendering required creative solutions to maintain performance across devices.
Challenge: Smoothly transitioning the same SVG elements from a Lollipop chart (X/Y axes) to a Radial Bar chart (Polar coordinates) without destroying the DOM elements.
Solution: I utilized D3's attrTween functions to interpolate path data strings. By maintaining a single SVG context and simply updating scales and opacities based on the active scroll step, I achieved a seamless morphing effect that tells a continuous data story.
Challenge: The "sticky left panel" design breaks on mobile, where vertical space is limited. Users would scroll past the text without seeing the associated chart.
Solution: I wrote a custom createMobileVisuals() function that detects the screen size. On mobile, it clones the relevant visual asset from the sticky panel and injects it directly into the scrolling content flow (the narrative steps), ensuring the data is always visible in context.
Challenge: Triggering heavy chart animations on the main thread during scroll events caused jank.
Solution: I moved away from standard scroll event listeners and implemented an IntersectionObserver. This allows the browser to efficiently notify the app only when a specific narrative step enters the viewport, triggering the animation frame only when strictly necessary.
This project showcases my ability to handle complex data visualization libraries and integrate them into a modern, responsive web experience. It moves beyond simple static charts to create a living, breathing document that stays interesting through interaction and motion.